
Probleme lösen – Auf 1 A3-Seite
Visualzation of the problem-solving process
A blog post by Dr. Uwe-Klaus Jarosch, March 2026
Have you ever read or even created an A3 report?
If so, then you are familiar with the overview that the summary presentation of the A3 report provides, especially for the management.
In this series of blogs, I will be looking at methods for problem solving.
Similar to the 8D process, I believe that the A3 report or A3 method is less about methods and more about a sequence of methods for moving from an incident to a permanent solution.
Furthermore, the strength of this approach lies in the clear visualization of goals and results.
of blog posts I care about methods for problem-solving.
Is the 8D process well placed in this series at all?
I think: Yes. 8D process is very prominent and strongly related to problem-solving.
History
In the late 1980s, Toyota triggered a cultural revolution in the automotive industry:
With the development of the TPS, the Toyota Production System, a new type of operating system for developing and building cars was created.
The foundations for this were laid in the 1940s and 1950s by quality pioneers Joseph M. Juran and William Edwards Deming.
A key principle of the TPS was to visualize the recognized state. This creates clarity and makes decisions comprehensible.
Of course, Toyota also had problems. And so there were also procedures for solving problems.
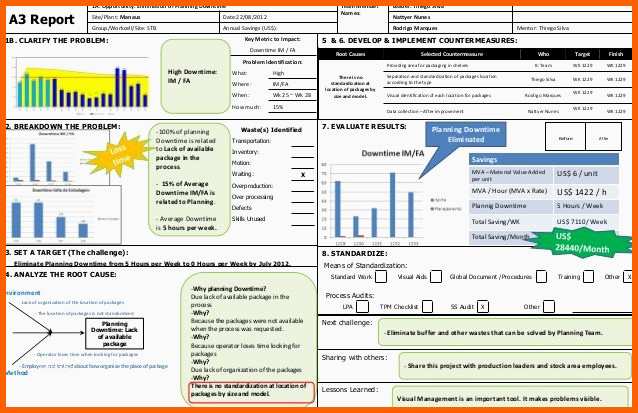
The name A3 report comes from the summary page of the report. All key statements should be condensed onto one A3 landscape page.
This means that, on the one hand, we can look at a process that has similarities with the 8D process and was developed at almost the same time. On the other hand, we see the visualization tool, which graphically presents and summarizes the numerous details of a problem solution. This makes this sheet and this procedure suitable for management.
A3 Report – Procedure
The comparison of A3 with 8D is obvious.
– Both processes require a similar number of steps.
– In both processes, an incident or problem triggers the process.
– In both processes, the ultimate goal is to establish a permanent solution.
I would like to examine the differences between A3 and 8D/Global8D below.
I refer to the detailed discussion of the 8D process in my previous post.
1) Clarify the problem and form the team
The vast majority of issues that trigger an A3 process will be internal. From observing A3 reports in my former company, I see two types of issues:
- a) Problems, deficits, and adverse developments that have developed into the current state, which became apparent through some key figure or anomaly and now, through management attention, are leading to a problem-solving process.
- b) Acute internal problems or deficiencies that significantly hinder business operations in terms of process and/or results and must be permanently remedied.
Some companies also use A3 as “Practical Problem Solving (PPS)” in a second “wave” after acute problems with a direct impact on customers have been solved in the first wave.
In this sense, 8D would tend to concern the first wave, followed by A3 in the second wave. Further waves are then conceivable when it comes to medium and long-term improvement.
Step 1 involves describing the problem and forming an appropriate team.
It is desirable at this stage that the problem can be visualized and quantified.
To this end, a comparison of the ideal state, the target state, the actual state, and the problem derived from this can be formulated in step 1.
As in 8D, the team is an important factor, especially management sponsorship and the expertise of specialists.
Step 1 of the A3 process thus corresponds to D0 from Global8D, D1, and D2.
2) Analyze the problem, decomposition
Step 2 goes beyond simply naming the problem.
What are the main deviations from the target state?
What rules or standards should have been followed?
Where in the observed process could the problem arise, where should it be detected?
If the problem arose in a manufacturing process, it often makes sense to first identify the exact process flow and then identify possible points of influence in the process, i.e., to look for the points where a root cause analysis should begin.
The 8D process does not explicitly instruct you to break down the problem. If you consider the Global8D process with its data collection in D0, the description of the problem for the supplier results in a similar task in D2.
A step with immediate containment actions to protect the customer, similar to step D3 in the 8D process, can be used on a company-specific basis. However, if the A3 report is used as a second wave, no external customer or end user is affected yet or anymore.
3) Target
What should the A3 team achieve?
If the aim is not to remedy a local acute problem in the short term, but rather to reverse a trend or tackle a more complex problem, the target description may be a series of sub-targets or a significant improvement, but realistically not the ideal situation.
In practice, it will be a target in the magic triangle between deadline, costs, and function.
This step does not occur in the 8D process.
4 Root Cause Analysis
Here we are back on track with the 8D process.
Typical for the A3 report is the use of Ishikawa and/or 5xWhy for the analysis of root causes. Both methods are graphical and therefore well suited for visualization.
Depending on company-specific rules, both methods are mandatory or alternatively required.
In my experience, when dealing with problems involving specific products or production processes, consulting the relevant design and process FMEA is an important part of the root cause analysis. If it has been created conscientiously, probable causes and consequences should already be described there. And if new findings come to light, the FMEA should also be updated.
The search for root causes in A3 also follows the principles
- Search in all potential directions that have a cause-to-effect relationship with the identified problem.
- Search only as far as the team can influence.
Typical for the use of Ishikawa and 5xWhy is to prioritize identified root causes and then work through the subsequent steps according to these priorities.
5) Develop countermeasures
6) Implement countermeasures
These two steps correspond exactly to the procedure in steps D5 and D6 of the 8D process.
Here, too, in the case of direct reference to products and manufacturing processes, the selected measures should be directly taken into account, evaluated, and tracked in the FMEA.
In the case of business processes or changes in the infrastructure of a company, this parallel will not usually exist.
7 Evaluate/track the results
While steps 5 and 6 correspond to the “Do” in Shewhart’s PDCA cycle, step 7 is dedicated to the C for “Check.”
In this step of the A3 process, a certain amount of time is needed to gather evidence.
How does the optimized process perform with the new rules?
Can we achieve the goals set in step 3?
This check is essential. It is not hope for success that is needed, but proof of it.
This proof can usually be visualized well.
In the 8D process, proof of effectiveness is already part of D5 and is required before the measures can be implemented in the process.
However, this approach is not suitable for the more medium to long-term effects addressed in A3 problems. Hence, this approach is a separate step.
8) Make the result the standard and disseminate the standard (lessons learned)
This step is also very similar to the 8D process, discipline D7.
Standardization means that there is a defined rule for action.
If changes or improvements have been made as part of the A3 process, these new specifications must be incorporated into these rules.
We are talking about production control plans in processes, work and testing instructions that may be product-independent and universally applicable. This may concern company standards and thus describe the method, tools, processes, and results assurance for certain procedures. Or it may be forms, checklists, questionnaires, or digital process controls and programming that have now been adapted with optimized knowledge.
With the valid approval of the updated status, these results become authorized and mandatory within the company.
Without authorization, the goal of step 8 cannot be achieved, as everyone can do what they want.
If a standard is updated in the company, this implies an obligation for all users of the standard to also use the latest version.
This can be requested at least for new projects.
In ongoing projects, the application of new rules usually causes massive problems:
- Changes to internal standards lead to unplanned extra work.
- Changes to internal standards may have to be renegotiated with the customer.
- Changes to internal standards lead to additional costs for equipment, tools, and possibly also during ongoing operations, e.g., if test specifications and frequencies are affected.
The often-quoted phrase “whoever orders pays” could be interpreted to mean that the person who authorizes the new standard must also provide the budget to cover additional work, investments, and ongoing additional costs.
However, after carefully weighing up the advantages and consequences of a change in the standard, it can be assumed that only those changes that bring lasting benefits to the company, including the organizational units affected, will be incorporated.
This reaches its limits when, for example, several departments in a plant have to work within fixed budgets and no compensation is practiced between the departments.
Example: Due to repeated measurement errors and the resulting problems in the process, new minimum requirements for a measurement procedure are specified. The quality assurance department at Plant X must cover the cost of purchasing a higher-quality measuring device and the increased testing frequency from its budget. Apart from requesting additional funds, the only options are to cut back on other tasks or not comply with the new standard, arguing that the current project is protected by grandfathering provisions. Without additional funds, this lesson learned would be wasted.
If the funds were provided by production, for example, the additional expense could be recouped in the medium term through a more stable process or a lower complaint rate.
Perhaps this LL will also be rejected because different boundary conditions apply to this plant and the problem has been proven not to occur.
In addition to authorizing A3 results as a standard, the distribution of this new standard plays a central role in every scenario, which is also a management task.
In the A3 report, lessons learned are only initiated and cannot be accounted for by the A3 team.
Conclusions:
- The A3 report describes a problem-solving process developed by Toyota with management-friendly visualization.
- The steps are very similar to the 8D process – except for the immediate measures and the explicit formulation of goals.
- Ishikawa and 5xWhy have their strengths, which is why they are chosen as methods in the process. However, they also have weaknesses that are not taken into account.
- The A3 report is aimed more at medium-term than short-term problems.
- The A3 report takes the time to monitor the effectiveness of the measures.
- A3 results need authorization to become effective as a new standard – as always, budget issues need to be clarified.
Stay curious
Yours
Uwe Jarosch