
Root Cause Analysis using Ishikawa Diagram
A blog post by Dr. Uwe-Klaus Jarosch, February 2026
One of the 7 quality standard (core) tools is the Ishikawa diagram.
This graphical method has been invented by the Japanese engineer Kaoru Ishikawa in 1943. His intention was to give a structure and promote visibility of causes of a quality problem, and to prevent to work mainly on symptoms.
The design of the diagram – similar to the bones of a fish – has given the popular name of the “fish bone diagram”.
The idea of the diagram is to use the creativity of the team for collection and structuring of inputs.
Methodically, the idea of problem solving as of Ishikawa exceeds to fill the diagram. Contents to solve the dedicated problem will come from a 7 step work procedure:
Step 1 Clear Problem Definition
In the „head“ of the fish bone the precise problem description needs to be written as a starting point.
This formulation shall be valid for all team members and should be clear for third parties.
Step 2 Determine the Main Categories of Influence
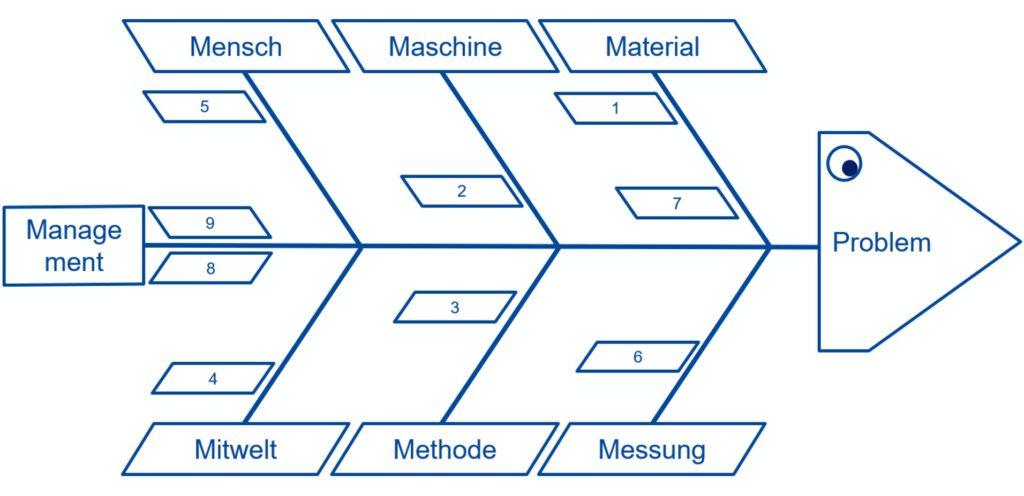
Cause categories will be assigned to the branches of the diagram. Typically, the main categories are identical with the 6Ms (e.g. man, machine, material, method, milieu, management, measurement).
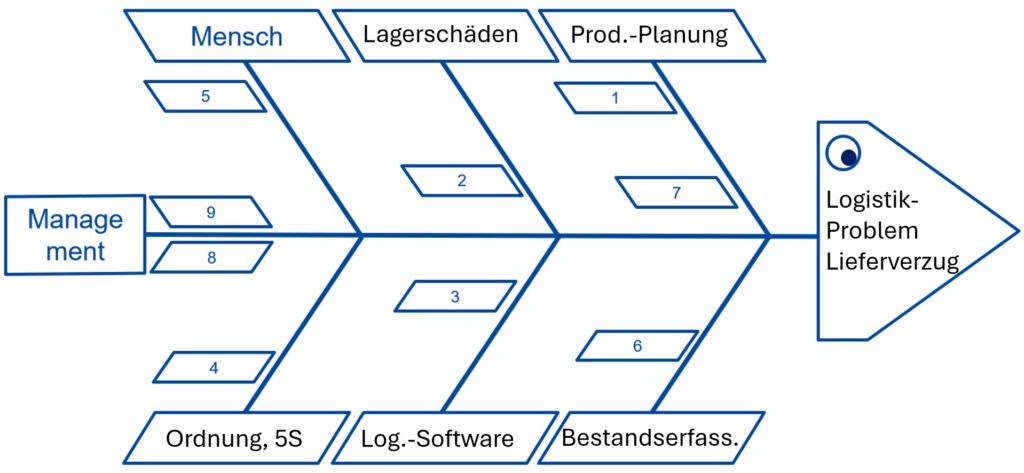
The main categories may added or changed by alternatives. This is recommended if categories can be named more relevant for the problem to solve.
Step 3 Brainstorming to Collect Potential Causes
The team collects potential causes. The collection shall be performed without any rating. Every input is welcome. Kaoru Ishikawa pronounces the teamwork: as more perspectives join as more complete the analysis can be.
Step 4 Sort the Causes in a Structure
All collected potential causes will be grouped and assigned to the categories. If needed entries may get additional information to make them more precise.
Cause – to – effect relations may be expressed as sub branches in the diagram. This makes logical constraints visible.
Step 5 Check of Completeness
At the end of collection and sorting the diagram should be checked in a honest manner:
- Any aspects of the problem missing from a professional view? Is it necessary to add or align categories ?
- Are the potential causes well addressed in the logical chain and to the categories?
This step shall avoid incorrect quick shots.
Step 6 Analysis and Rating
Now all listed causes will be checked for relevance and will be rated by the competence of the team.
This will show the most important root causes as a priority.
In case there are facts and dates for this problem statistics like Pareto analysis may be used to support priorization.
Step 7 Derive Actions
In this step for all prioritized root causes dedicated improvement actions will be develope.
From first days of Ishikawa method it was pronounced to have actions against the root causes, not against any symptoms.
But not every root cause needs to have actions. Priority setting is important here as well.
Actions are not part of the diagram visualization.
Pro & Con
A Pro for Ishikawa method is to have an easy to use method. It can be done with easy tools like white board and postits and immediately creates a visual result.
With a correct problem description, with an expert team and with carefull assignment and priorization of causes the baseline for meaningful actions is given in relatively short time.
For most day by day problems and as a start of problem solving this method is approved.
Weaknesses of the method come up if team members rely on prejudice ( This problem we know for long time !) or if the bias by superiors instead of impression of experts is collected.
It might be a weakness to collect causes by brainstorming instead of using a date & fact analysis. For me this a lack of a systematic approach.
A further weakness exists if the used categories are not appropriate for the problem.
Further more, the cause to effect analysis as shown in the diagram is mainly mono causal. Timely sequences are not respected in the presentation concept.
As in every method it is a question of experience in moderation. Too little experience and rehearsal may lead to wrong cause – to – effect relations (henn or egg problem). In such a case actions would possibly be addressed to symptoms instead of root causes. A well done prioritization is important and influenced by the moderation expertise.
Both will lead to failures in analysis and is reducing the efforts value add.
In order to solve the problem permanently a focus on the detected root causes is essential. Actions need to prevent such root causes and need to be tracked consequently. But this is a valid issue in every problem solving method.
Solving Methods for Complicated Problems
Ishikawa is using creativity of the team and refers in a reasonable level on results by chance. Complicated problems with several root causes may need other methods to be fully solved.
This may be root cause analysis based on statistical tools as given e.g. by the SixSigma toolbox or strictly logical analysis as given e.g. by Keppner – Tregoe Is-IsNot.
Conclusions:
- Problem solving via Ishikawa / fish bone diagram is one of the oldest and best established methods.
- This method is part of the 7 automotive quality core tools.
- The method is easy to learn and easy to apply.
- All team members need to be clear which problem shall be solved.
- Via brainstorming all ideas for causes will be collected from the team without any filter.
- 6M categories or problem specific categories help to sort causes and to find cause to effect chains.
- The team nominates causes that need to be worked on with priority.
- Actions to prevent such priority causes shall solve the problem.
- To solve complicated problems permanently it is recommended to use statistical and/or strictly logical methods for root cause finding.
Stay curious
Yours
Uwe Jarosch